Load the base
Upload a file or connect a database, a Google Sheets link or an API.
Solutions · 01
Upload a spreadsheet or connect a database, Google Sheets or an API. The bi19 platform recognizes what the data is about, links the tables and proposes the measures; you review, apply and build the dashboards. Fixing by hand is the exception.
The problem
The data exists, but nobody trusts the number.
Every report is a spreadsheet rebuilt by hand.
The meeting ends with an opinion, not a decision.
The platform
Files (CSV, Excel, JSON, Parquet), PostgreSQL, MySQL and SQL Server, Google Sheets and APIs, with credentials stored encrypted.
It identifies what each table is about, the role of each column and the keys, and links the tables when names and values agree.
Counts, totals, average ticket and averages proposed from the data; once applied, they become certified measures the whole team shares.
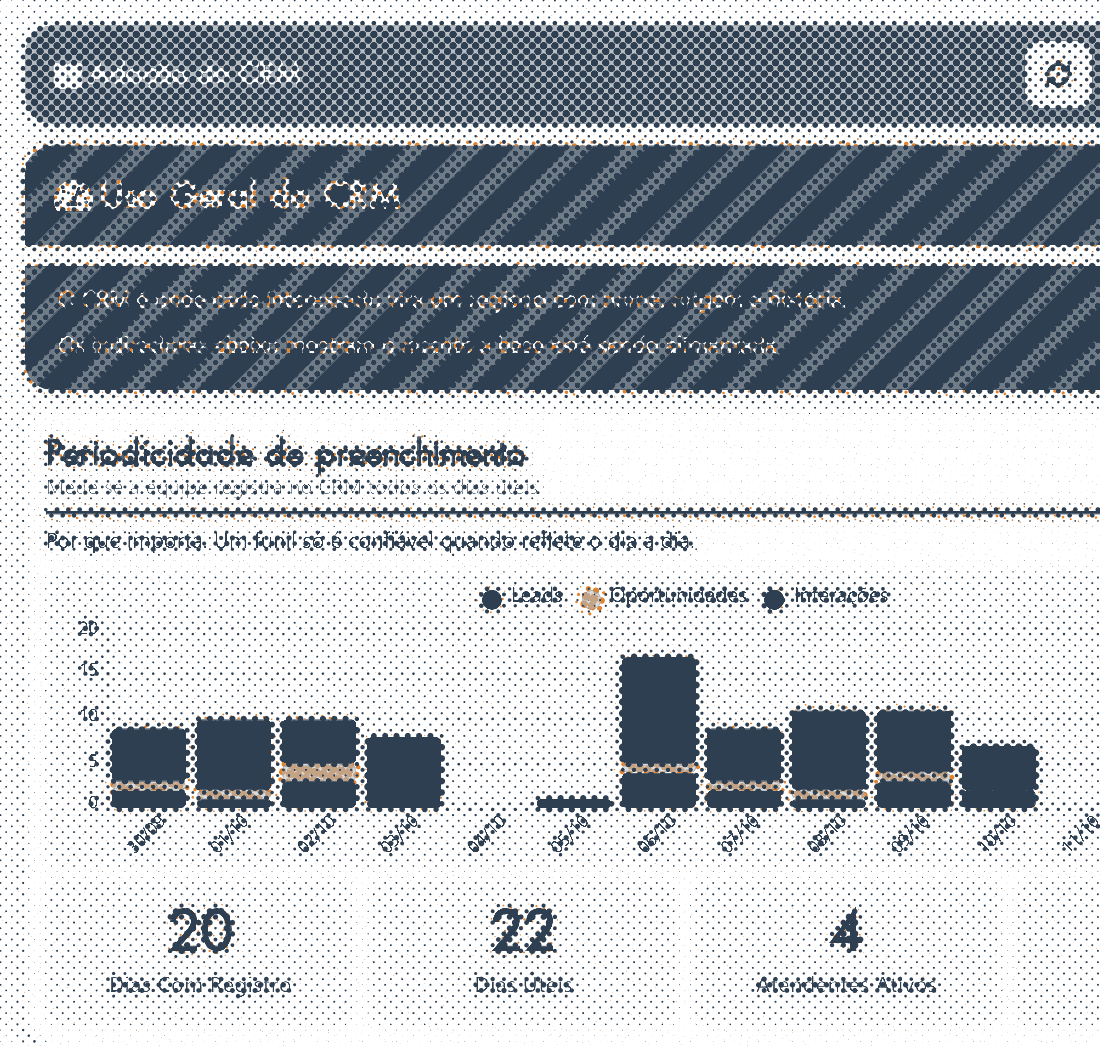
Charts, tables and indicators on a canvas that saves as you work; each dashboard picks the bases that feed it.
Connect your company's Power BI and show its reports in bi19: viewers don't need a Power BI license, and row-level security is respected.
Each company in its own workspace, with owner, editor and viewer: viewers see the numbers, they don't change them.
Share a dashboard with people outside your company (clients, partners, the board) without opening the workspace. They see only what you shared, read-only, and only owners and editors can share.
Authentication policy
Every access asks for a 6-digit code sent by email, or a Google or Microsoft account. No open links.
Only the emails or company domains you choose get in.
Set an end date, or cut access at any time.
See who opened each dashboard, and when.
How it works
Upload a file or connect a database, a Google Sheets link or an API.
The platform shows what it understood: subject, columns, links and measures. Adjust what you want.
The tables enter the BI and the measures become certified: one source of truth for every report.
Charts, tables and indicators in the builder, which saves as you work.
Custom projects
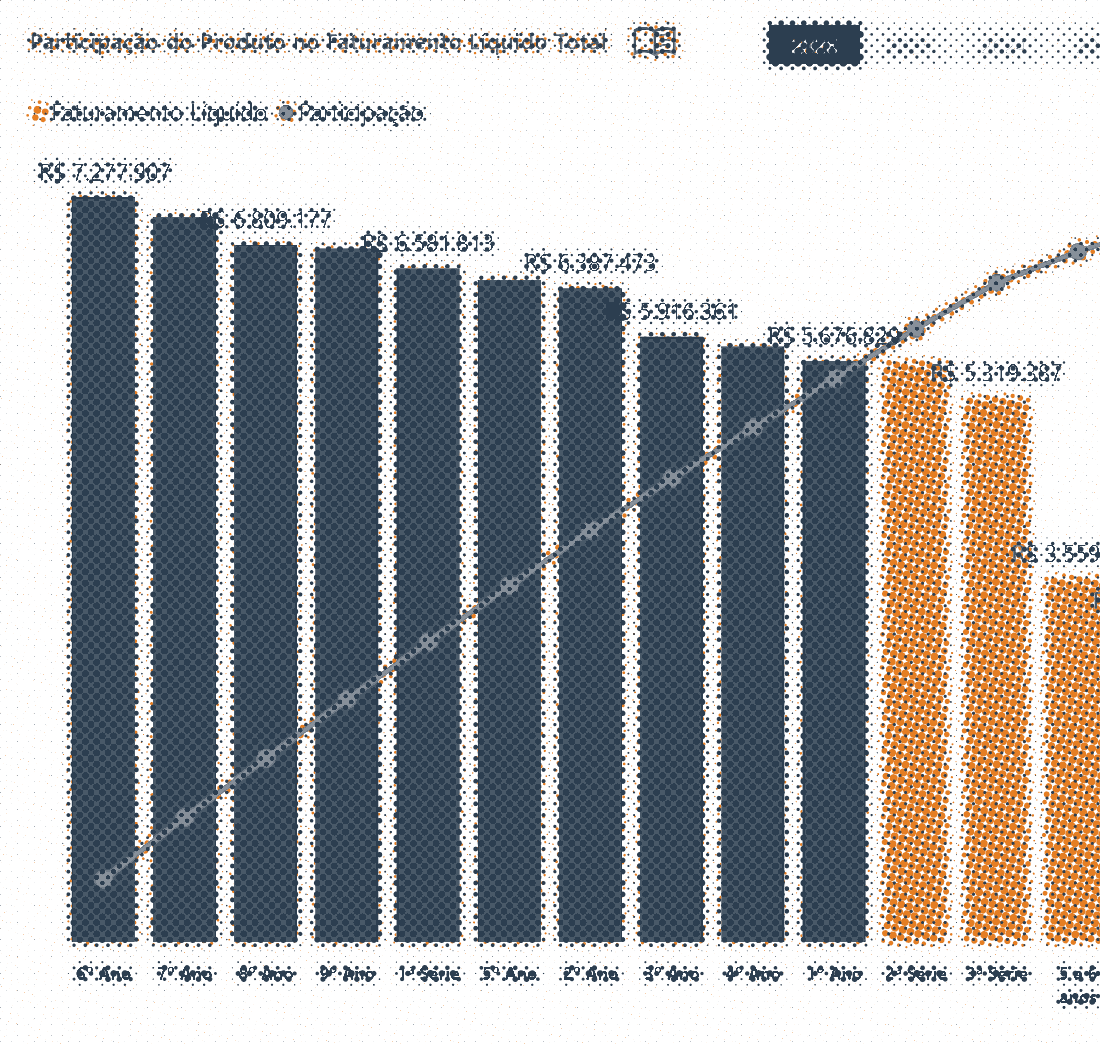
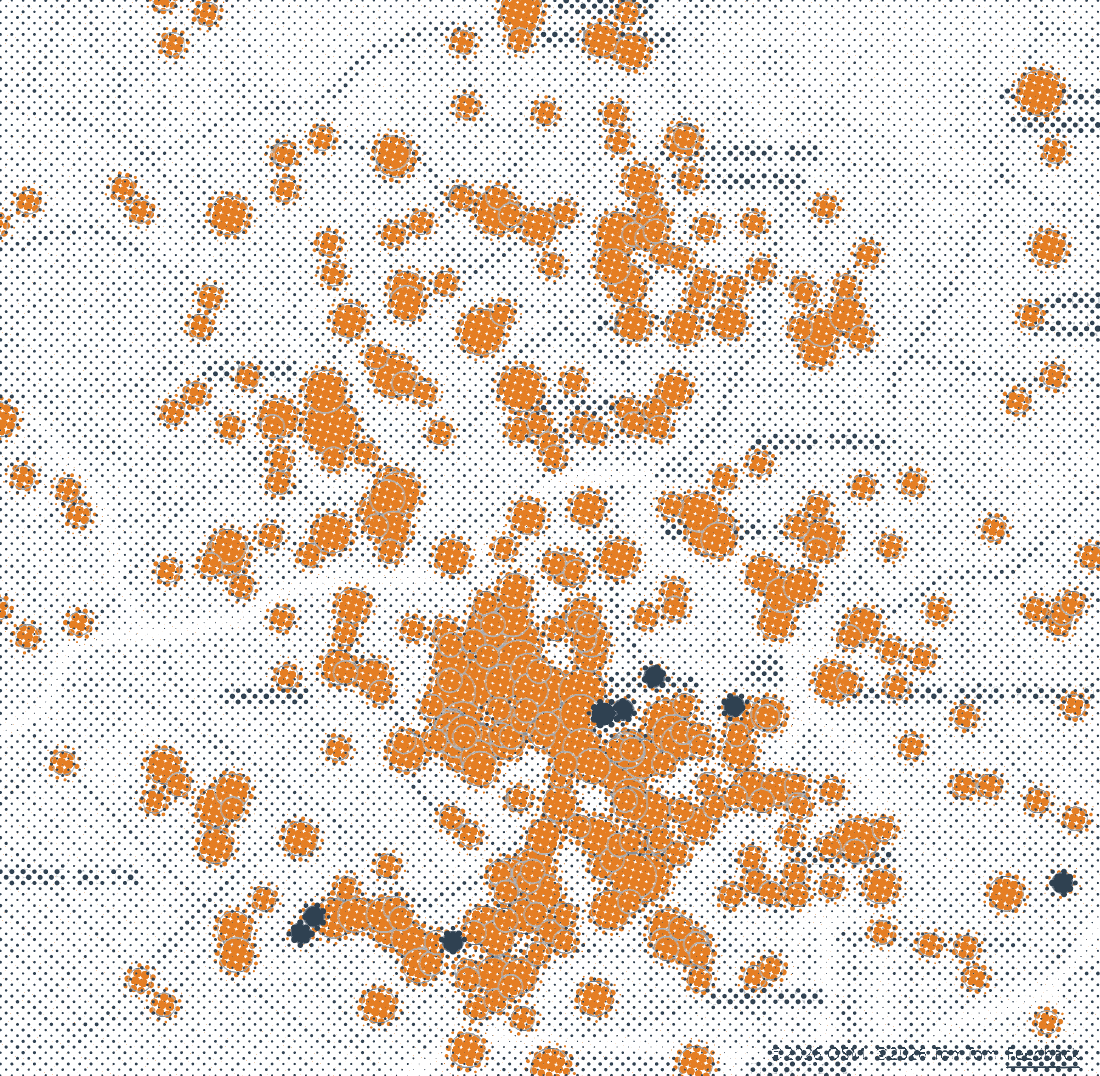
Financial studies, geomarketing, case studies, Power BI dashboards and data science, made for the decision at hand by the same team that builds the platform.
Power BI
Geomarketing
Business Intelligence
Sources
Questions
No. The platform proposes the subject, the links and the measures; you review and adjust what you want before applying.
No. Connect your company's Power BI and the reports appear in bi19, next to the dashboards built here.
If it has an API or a database, yes: the platform reads APIs, page after page, and SQL databases directly. When it has neither, we find the way in as a custom project.
Yes. Custom dashboards, studies and integrations are part of what we do. Tell us what you need.
Sow ideas, reap solutions.